


Raritan Power IQ
Easily manage data center energy, power and environment
 Description
 Further Information
 Similar products
 Print this page
 Request Price
 show my notes
 PDF
PDF
 Description
 Further Information
 PDF
PDF
For data center and lab managers who are concerned about the utilization and cost of power, Power IQ enables you to reduce capital and operating expenditures by providing the information and controls you need to be more energy efficient and fully utilize your existing power infrastructure.
Through one Web browser, the scalable Power IQ manages any SNMP-metered device. You have the ability to add new devices on your own. Support is preinstalled and tested for APC® , Avocent® , BayTech®, Cyber Switching®, Cyclades®, Eaton, Geist, HP®, Knurr®, Liebert, MRV ®, NetBotz, Raritan, Rittal®, Server Technology®, Sinetica, Starline Track Busway, Tripp Lite and UNITE™ devices.
Power IQ® Energy Management Software provides vendor agnostic centralized monitoring, agentless graceful OS shutdown, outlet control, powerful thermal and energy analytics of your active power, costs, line capacities, carbon footprint and rack temperature. Trending reports and cumulative totals can be displayed at the data center, floor, room, rack, customer and IT device level. You can generate customer energy billback cost reports in local currency with one click. Through one Web browser, the scalable Power IQ manages rack PDUs from most vendors including our award-winning intelligent PDUs from the Dominion PX series.
Devices equal a monitored IP address. For example, a single Dominion PX equals one device or a single APC PDU equals one device. Because environmental probes do not need IP addresses, they would not be considered devices.
Power IQ helps you become more effective in power capacity management and efficient in energy consumption by providing:
Security is ensured with standards-based authentication, Web session timeout and IP-based access control.
Simplifies PX configuration and firmware management.
The system is open database compliant (ODBC) and includes a web service API for easy intergration with your enterprise management sysems and scripts.
Efficiently Utilize Energy
Power IQ provides you with valuable information and automated control that can help you gain efficiencies in the data center right away, including:
Make Informed Capacity Planning Decisions
User-Configurable Energy Management Dashboard
Monitoring and Management
Automated Power Control
Power and Environmental Data Aggregation
Reporting and Charts
Open Data Model
Through one Web browser, the scalable Power IQ manages any SNMP-metered device. You have the ability to add new devices on your own. Support is preinstalled and tested for APC® , Avocent® , BayTech®, Cyber Switching®, Cyclades®, Eaton, Geist, HP®, Knurr®, Liebert, MRV ®, NetBotz, Raritan, Rittal®, Server Technology®, Sinetica, Starline Track Busway, Tripp Lite and UNITE™ devices.
Power IQ® Energy Management Software provides vendor agnostic centralized monitoring, agentless graceful OS shutdown, outlet control, powerful thermal and energy analytics of your active power, costs, line capacities, carbon footprint and rack temperature. Trending reports and cumulative totals can be displayed at the data center, floor, room, rack, customer and IT device level. You can generate customer energy billback cost reports in local currency with one click. Through one Web browser, the scalable Power IQ manages rack PDUs from most vendors including our award-winning intelligent PDUs from the Dominion PX series.
Devices equal a monitored IP address. For example, a single Dominion PX equals one device or a single APC PDU equals one device. Because environmental probes do not need IP addresses, they would not be considered devices.
Power IQ helps you become more effective in power capacity management and efficient in energy consumption by providing:
- User configurable dashboard
- Agentless graceful shutdown of Windows®, Linux® and Unix® device groups
- Psychrometric chart to calculate possible energy savings from simply increasing temperature
- Energy cost bill-back reports to drive behavior
- Decommission flags to forecast energy savings when eliminating servers
- Baseline consumption and changes of various energy saving initiatives
- Capture peak loads under compute stess to identify excess power capacity in the rack
- Power capacity forecast charts
- Power capacity utilization gauges
Security is ensured with standards-based authentication, Web session timeout and IP-based access control.
Simplifies PX configuration and firmware management.
The system is open database compliant (ODBC) and includes a web service API for easy intergration with your enterprise management sysems and scripts.
Efficiently Utilize Energy
Power IQ provides you with valuable information and automated control that can help you gain efficiencies in the data center right away, including:
- Baseline energy consumption and track changes by IT device, rack, zone, customer, department and data center
- Easily seeing if you are operating within industry-accepted and server manufacturers recommended temperature and humidity ranges
- Estimated savings calculation from increasing temperature to upper limit of recommendations
- Temperature threshold alert monitoring and trending, to safely manage environmental conditions
- Energy cost billback reports with one click
- Remote power on/off outlet groups
- Agentless graceful shutdown of system operating systems
Make Informed Capacity Planning Decisions
- Power IQ supplies actual load of IT devices under computing stress to provide yo
- with better planning information.
- Collect short- and long-term data and compare to rated capacity to update design assumptions
- Monitor trends, alerts and threshold violations to understand future needs
- Power capacity meter will provide you forecasted days of energy supply
User-Configurable Energy Management Dashboard
- Display on large screen in slide show mode with real-time updates
- Configurable size, layout and charts
- Display power and environmental health, energy capacity and consumption, weather services, maps, video and much more
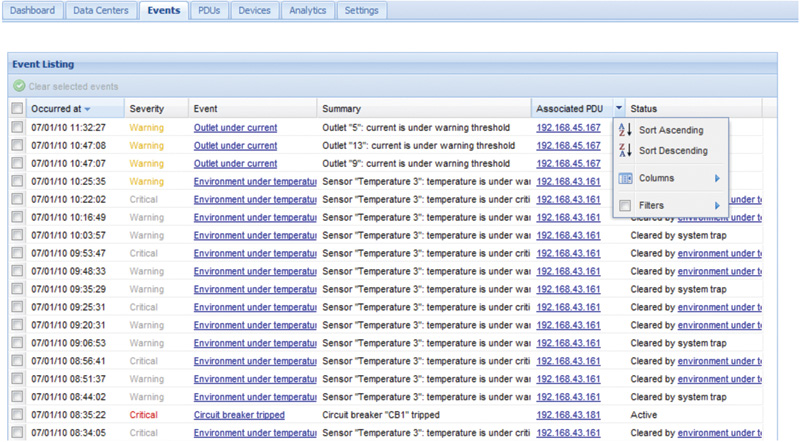
Monitoring and Management
- A central management console consolidates names, polling status, location, model and firmware onto one screen, saving valuable management time
- Bulk configuration and firmware distribution for PX PDUs
- Power and environmental events and notifications
Automated Power Control
- Remote power control of outlets, IT devices, device groups and racks
- Agentless graceful operating system shutdown
Power and Environmental Data Aggregation
- User-configurable collection intervals ensure desired accuracy while minimizing network traffic
- Aggregate active power, current, temperature and humidity data
Reporting and Charts
- Energy, cost and carbon consumption reports keep customers and/or internal departments informed
- Chargeback reports
- Exception reports help you find stranded power capacity
- Trending and status reports help you easily see future capacity needs
- Thermal analysis temperature and humidity compliance reports
- Power capacity meter will provide you with forecasted days of energy supply
Open Data Model
- Automatically shares information about racks, PDUs and outlets with dcTrack®. dcTrack displays rack PDU and sensor data collected by Power IQ
- Web Service API for easy integration with your systems and custom programs
- Open database connectivity capabilities let you use your existing data warehouse and reporting system to generate custom reports
- Import and export data via CSV file
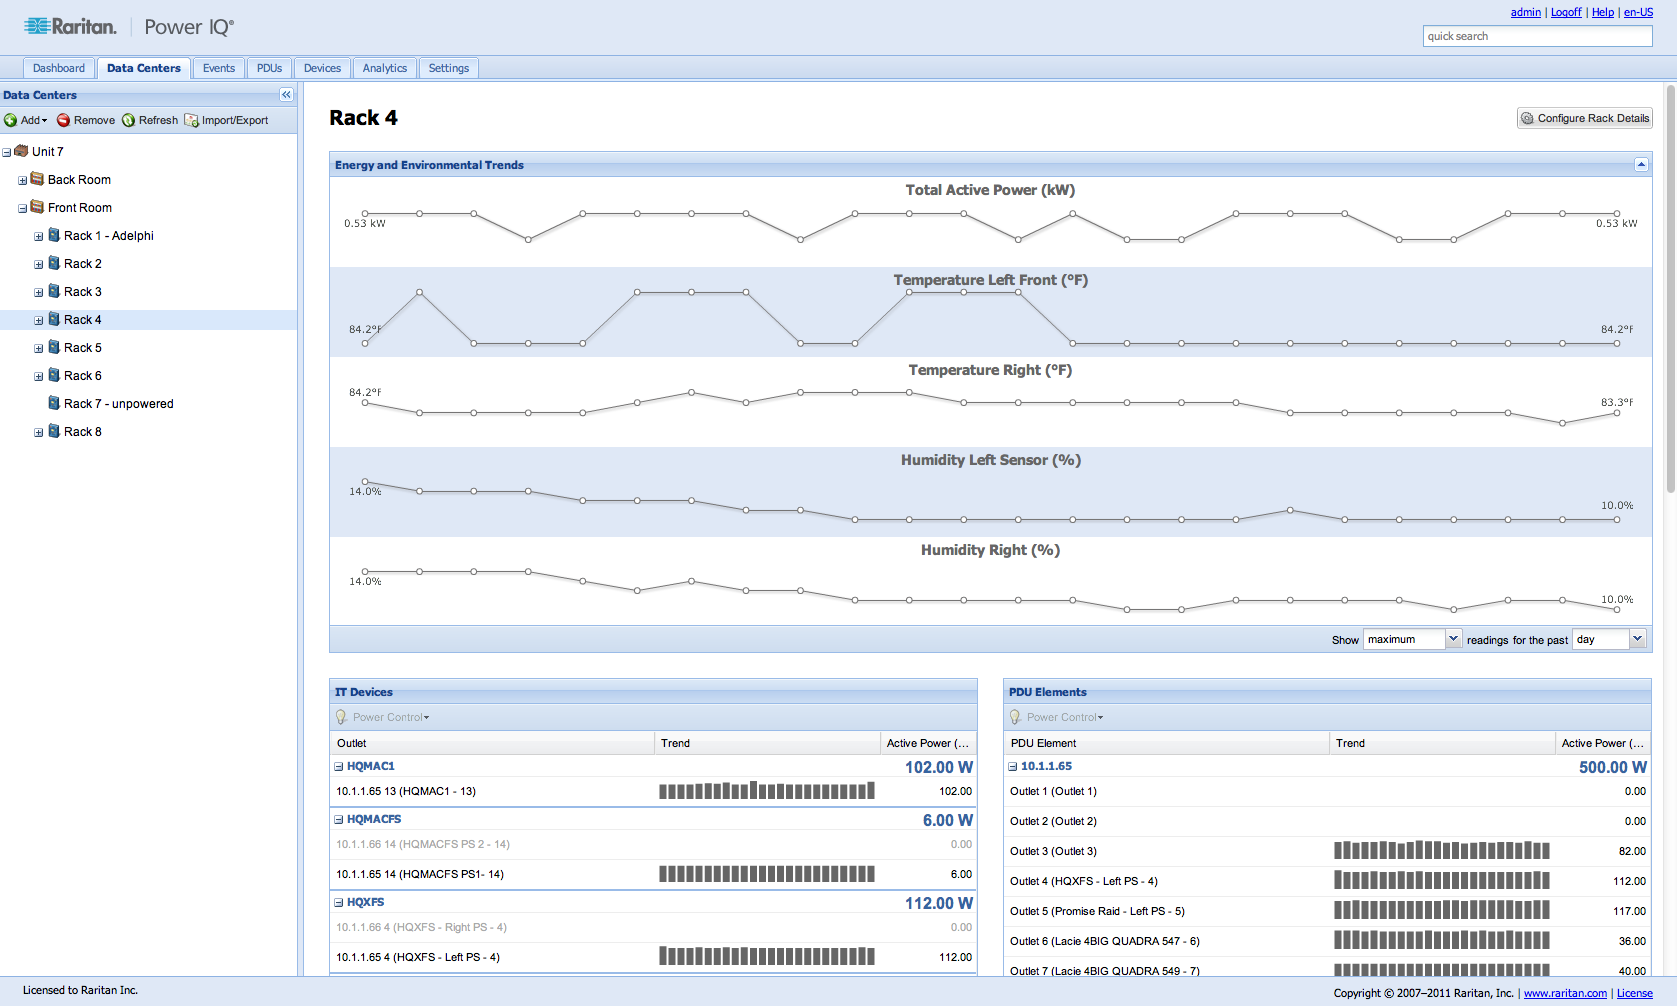
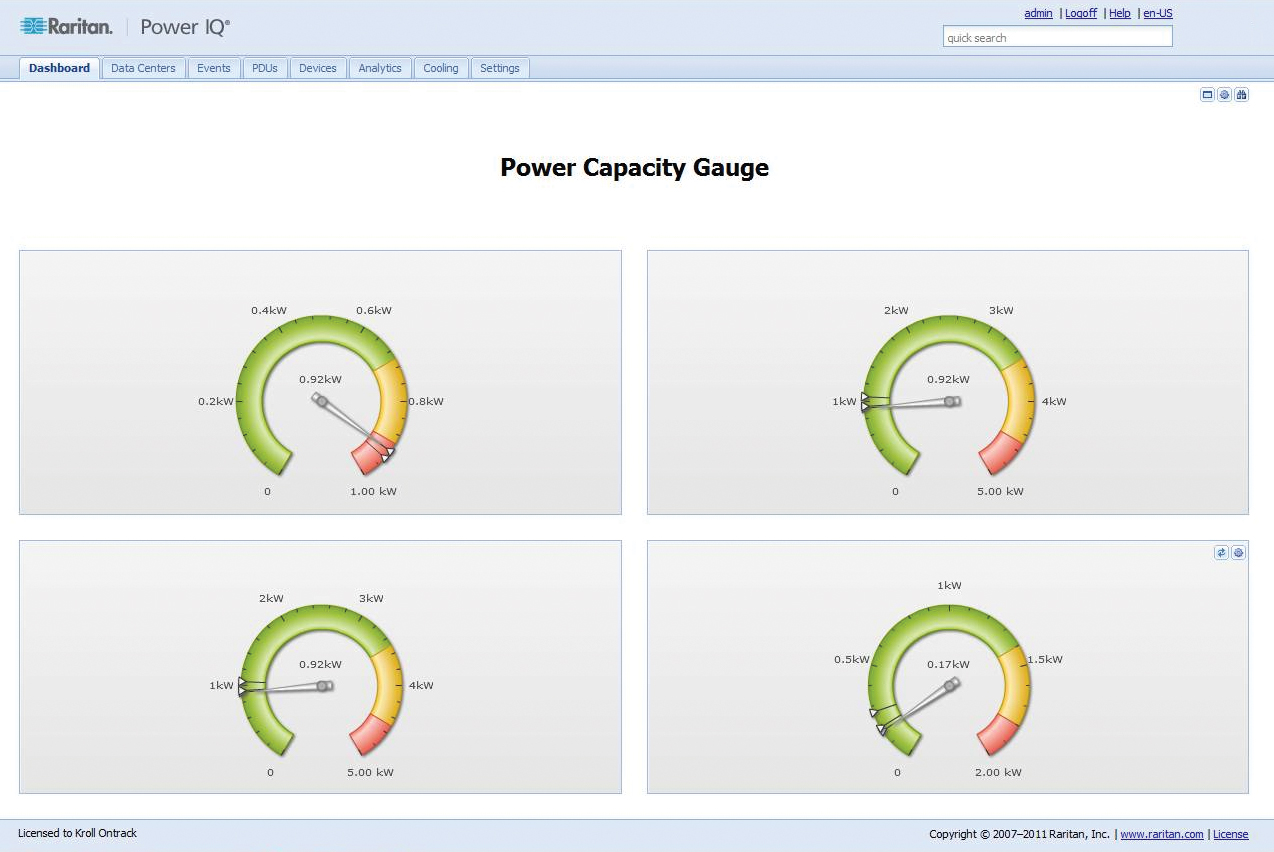
Smart Rack View Page
Our smart rack view page with quick charts provides one click access to rack power, cooling, airflow and events. This new view makes three-phase load balancing easy.
User-Configurable Dashboard
The user-configurable dashboard provides a large screen, centralized view of power and environmental health, energy capacity and consumption, weather services and maps.
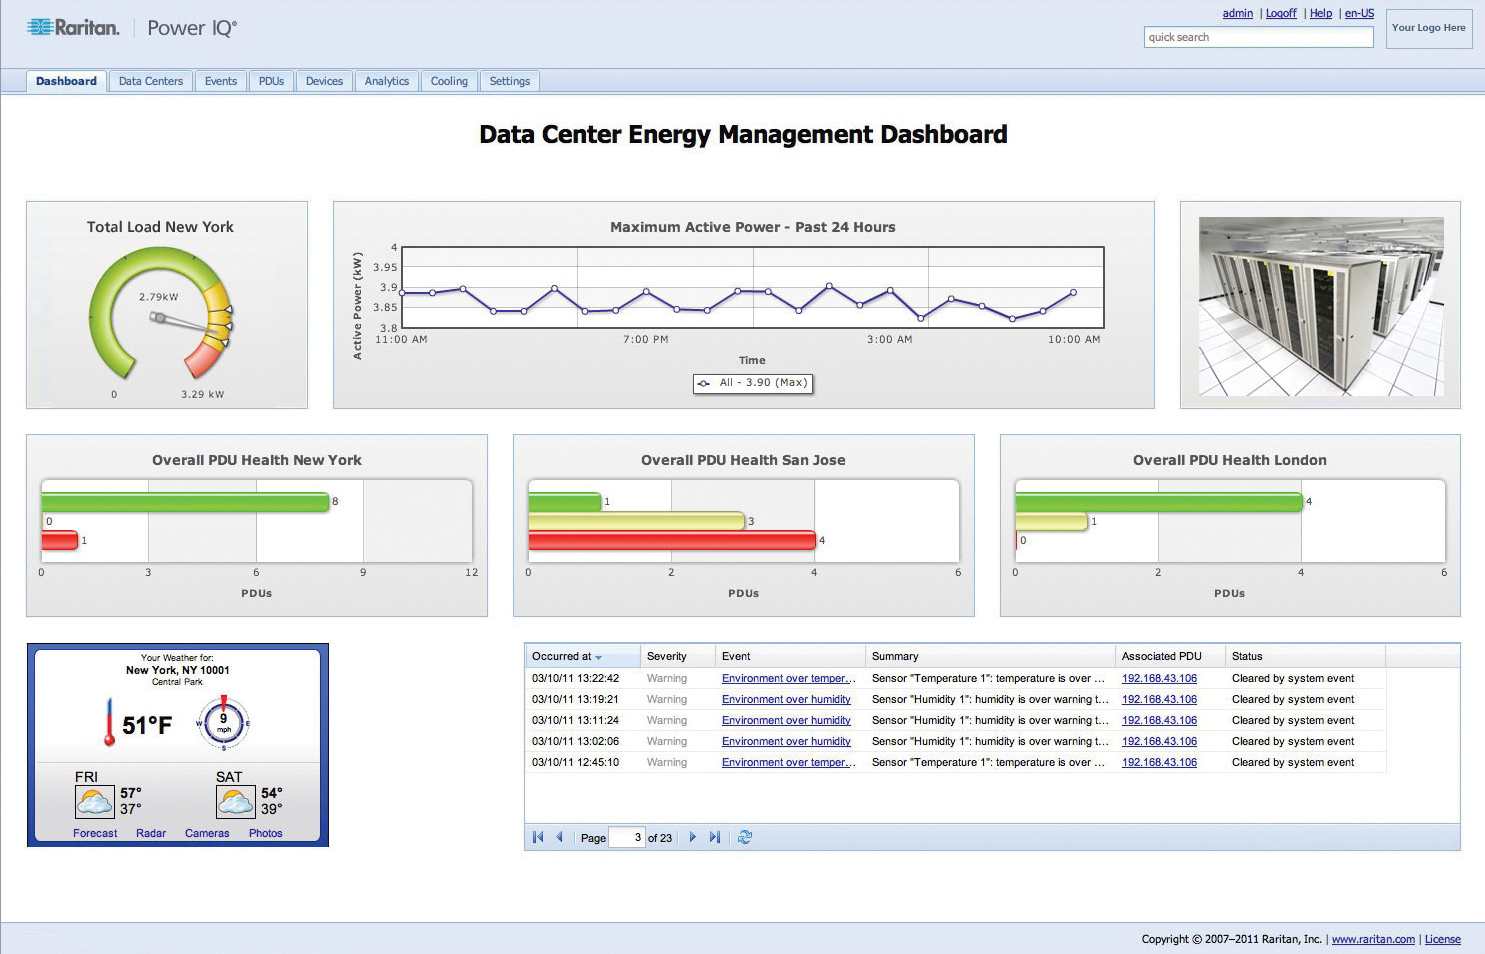
Power Capacity Gauge
Real-time power capacity utilization at any level in your data center or lab (PDU, rack, row, busway, room, etc.). See current, maximum and minimum load over selected time period.
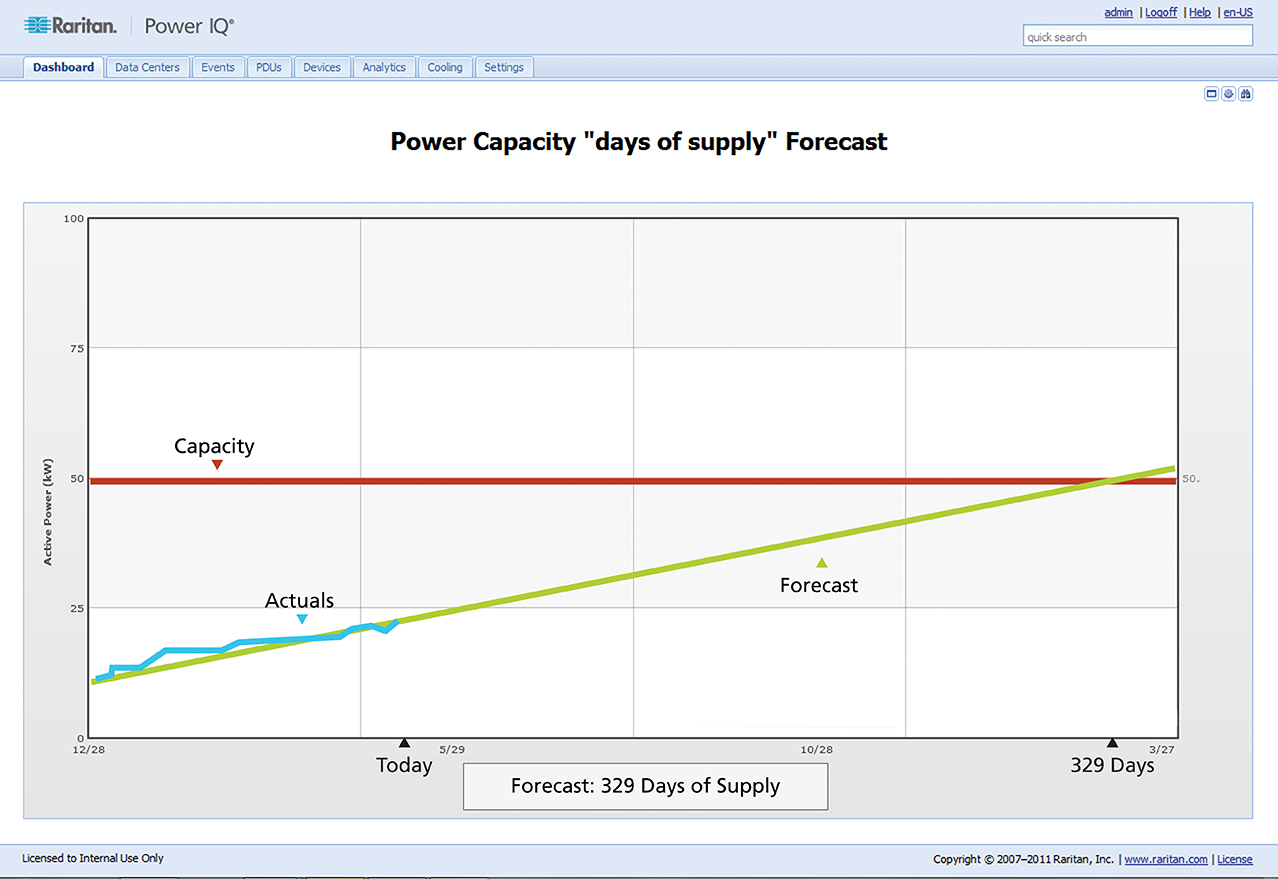
Power Capacity Days of Supply Forecast
Understand your real-time power load, rate of change and forecasted trends at all levels of your infrastructure with our capacity forecast charts.
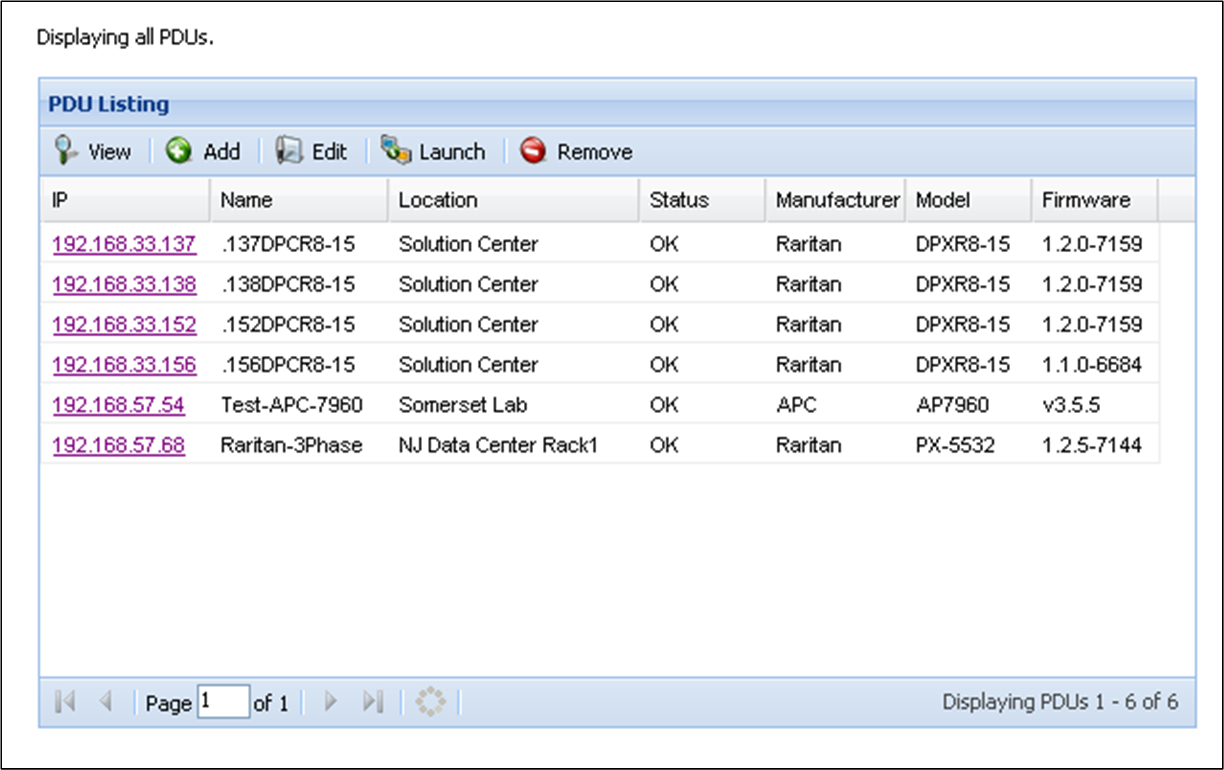
Central PDU Console
One "pane of glass" to manage all your rack PDUs and in-line meters - APC, Avocent, Cyber Switching, Geist, MRV, Raritan, Server Technology and more
Cooling Chart
Understand if you are compliant with manufacturer´s and industry-accepted recommendations, and project how much you can save by increasing room ambient temperatures.
Vendor Agnostic Monitoring and Management
Through one Web browser, the scalable Power IQ monitors and manages PDUs from APC, Avocent, BayTech, Cyber Switching, Geist, HP, Knurr, Liebert, MRV, Raritan, Rittal, Server Technology, UNITE and more.
Create Custom Reports
A powerful reporting function in Power IQ allows you to generate custom reports at the outlet, IT device, customer, department, rack, zone, floor, lab and data center levels. You can generate reports that reflect active power, energy cost and consumption, carbon footprint, temperature and humidity.
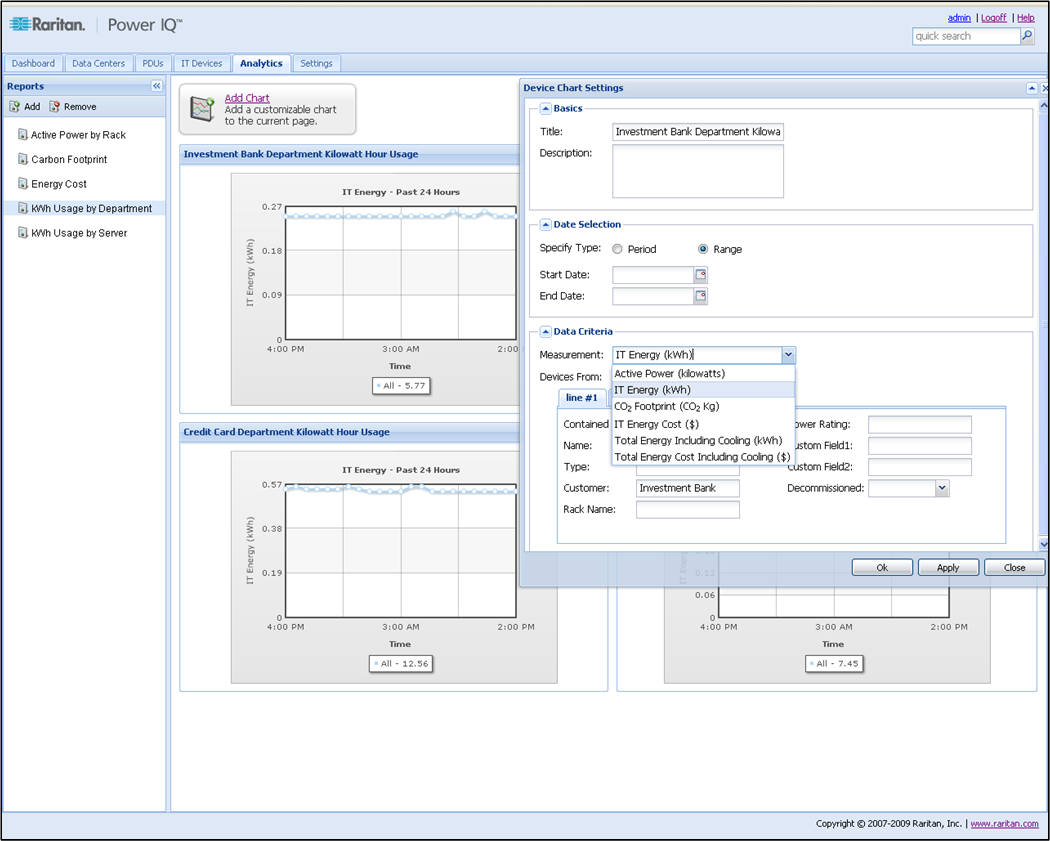
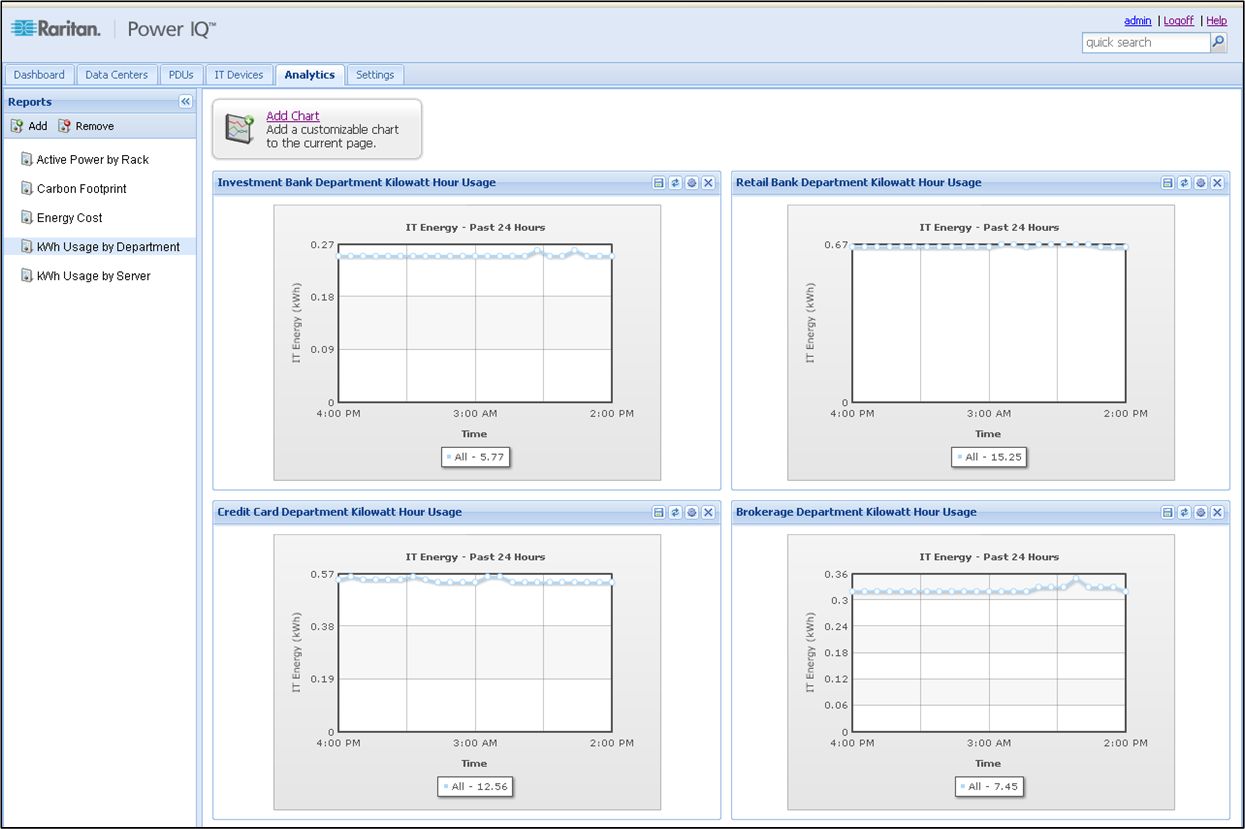
Report by Customer or Department
An example of a report that charts the energy used by a customer or department.
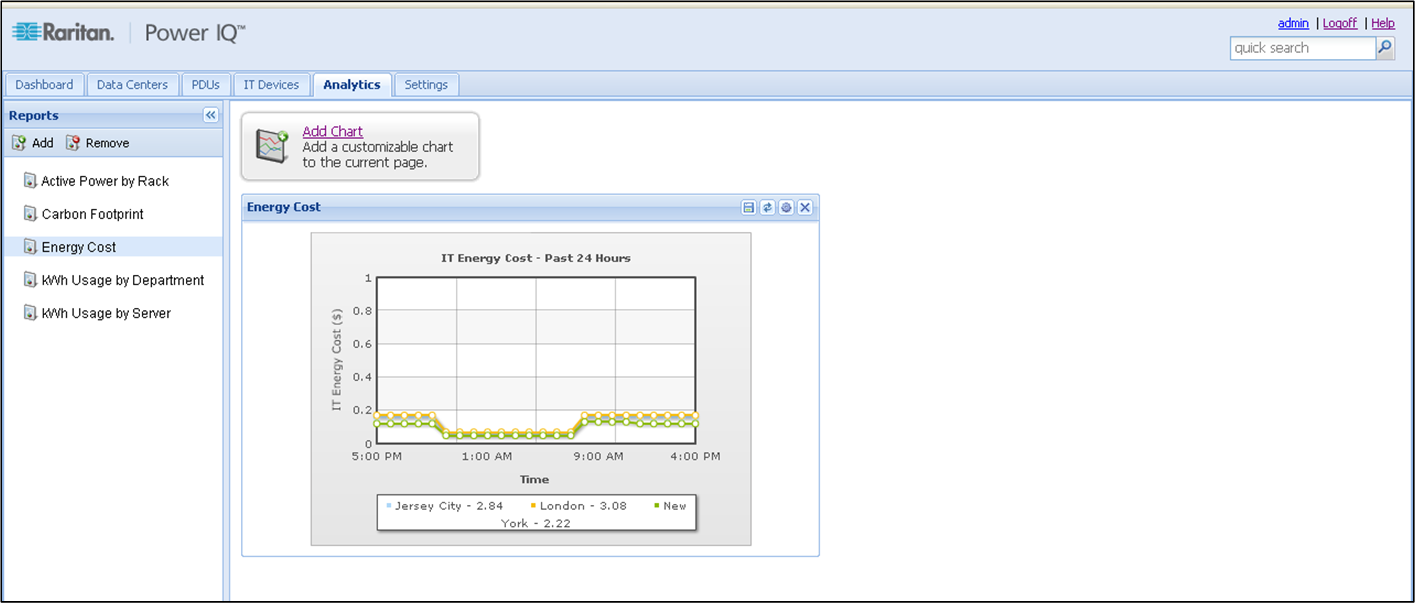
Report Energy Cost
You can also create reports that display energy costs over time for comparison purposes.
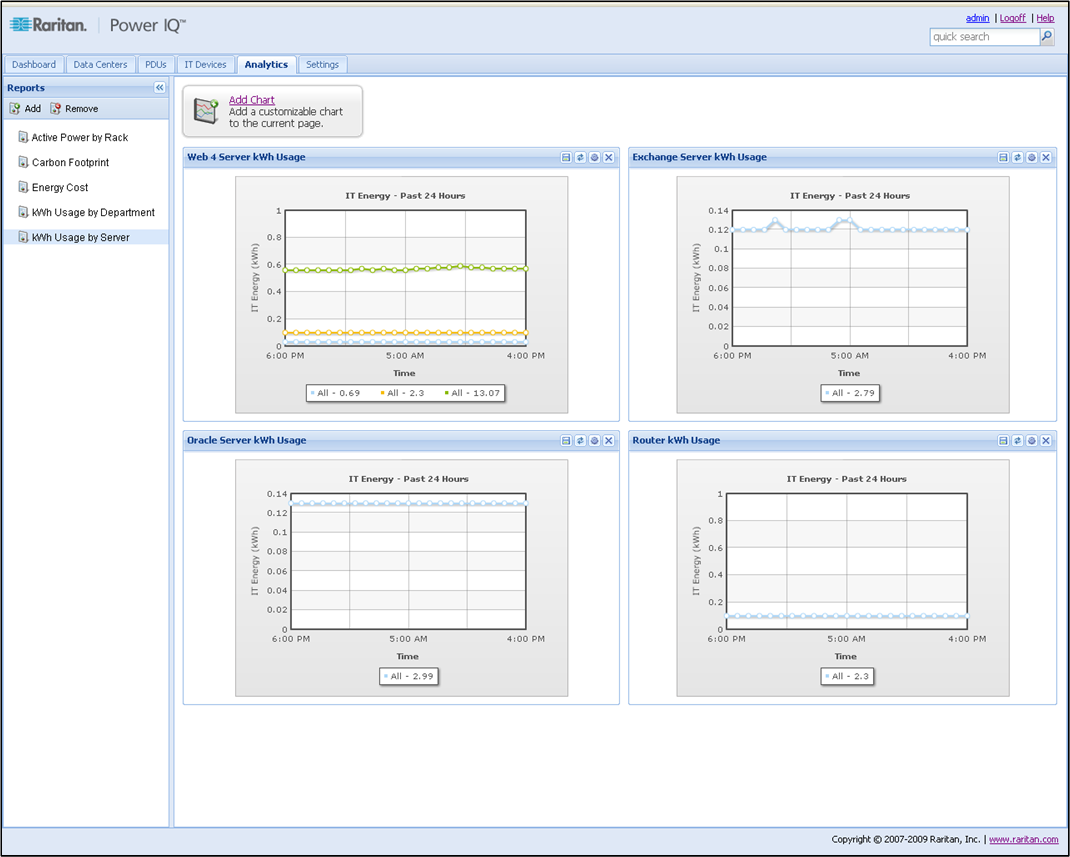
Report Usage via IT device or Outlet
A report charting the energy usage at the IT device level. Similar charts can be generated for usage reports at the outlet level.
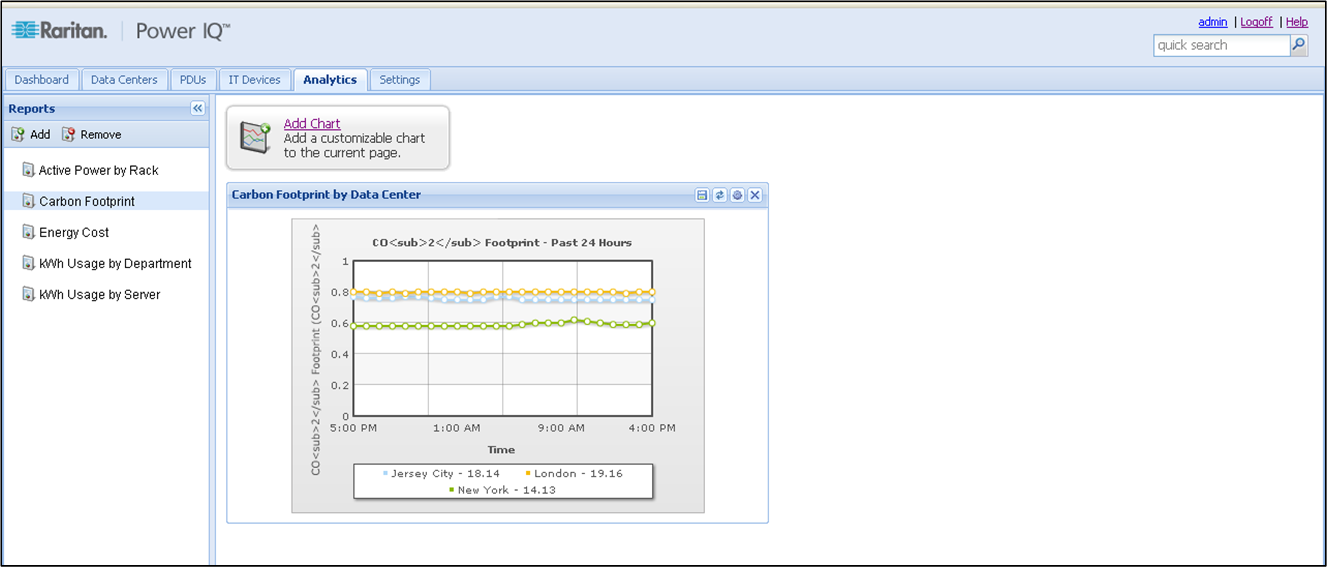
Report Carbon Footprint
An example of a carbon footprint report, showing how Power IQ enables you to graph multiple devices on a single chart for comparison purposes, as well as summarize the accumulated total per period.
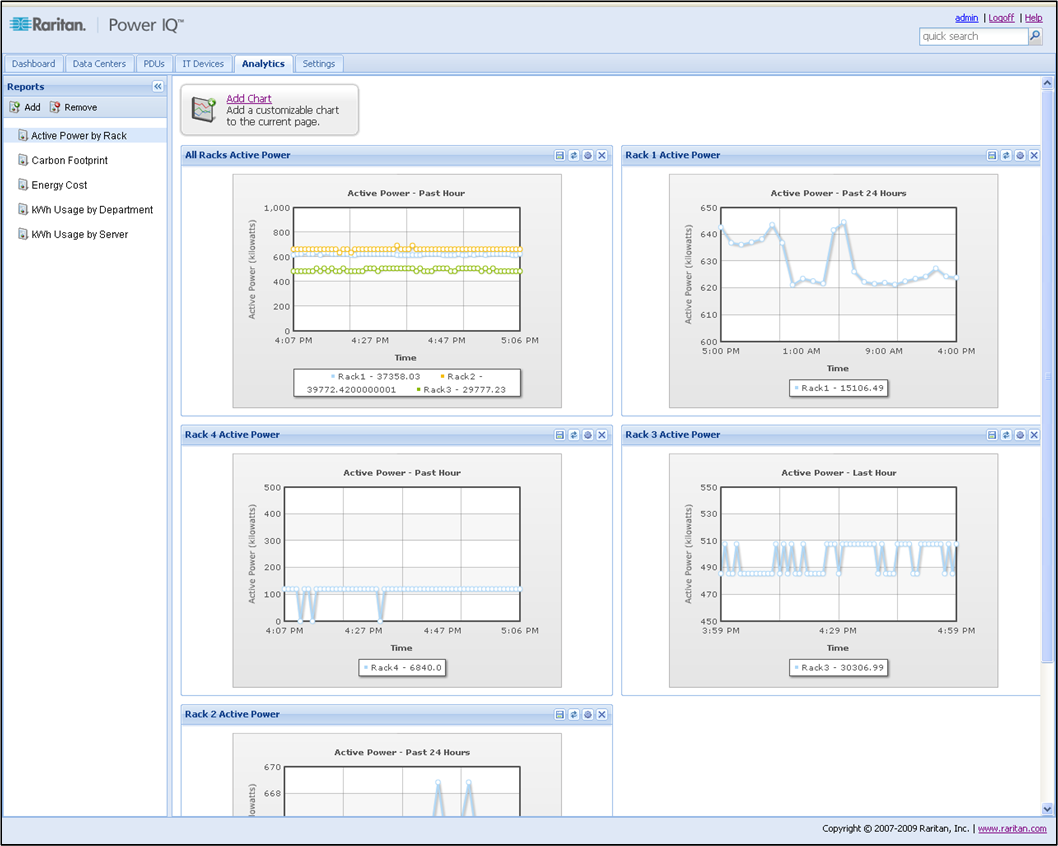
Report Active Power
Power IQ allows you to both create and save a number of standard reports from a single screen. You also have the ability to create and save a any number of charts within each report.
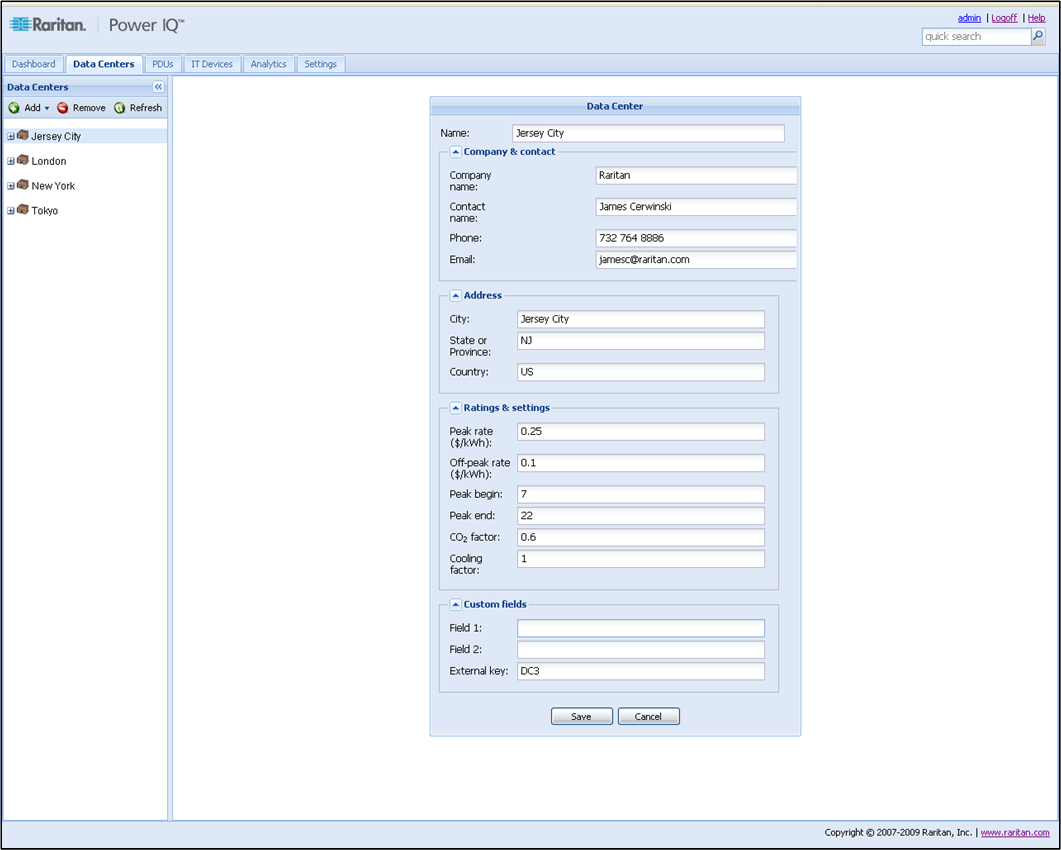
Data Center/Building Level Settings
Set your peak and off peak cost per Kilowatt-Hour, as well as carbon and cooling factors at each location.
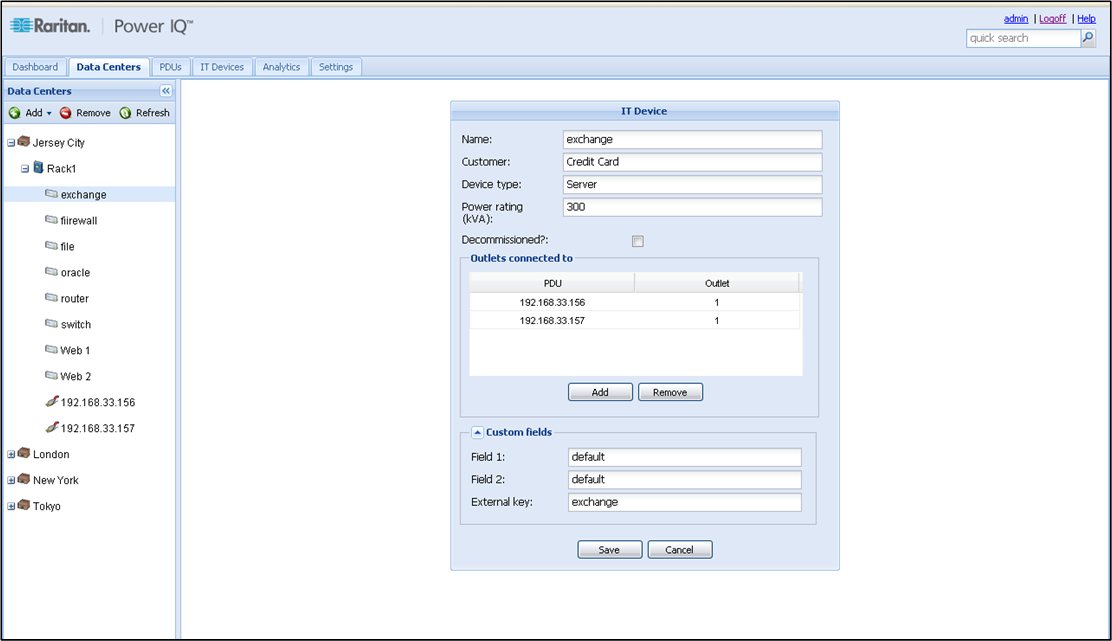
Floor/Zone/Row/Rack & IT Device Level Grouping & Associations
Associate outlets to IT devices. Group devices by customer, type or any use defined fields.
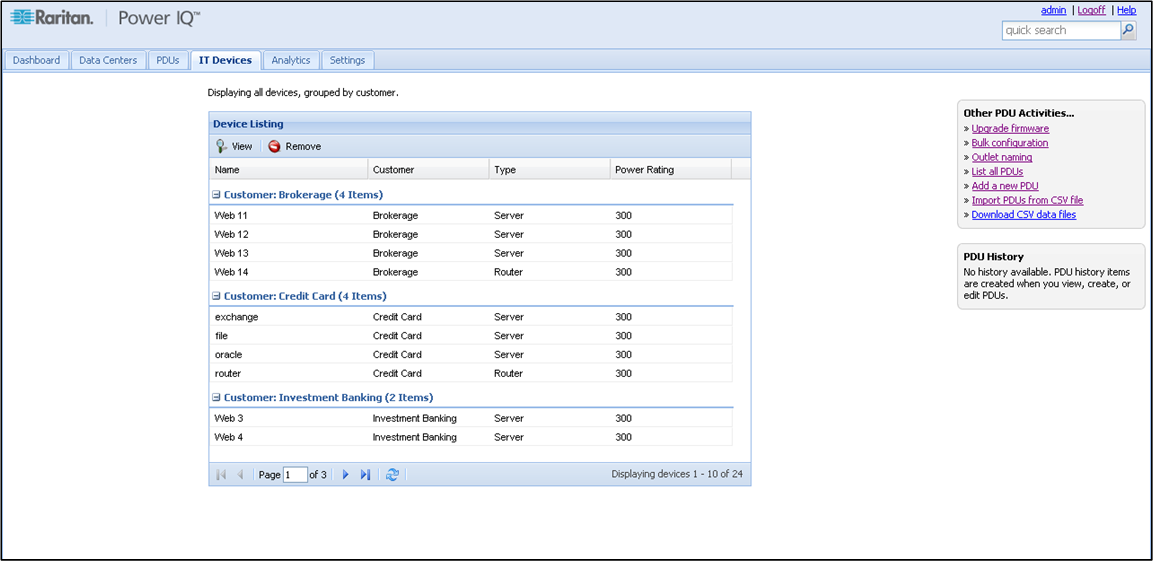
Group via IT Device Owner
Once a customer is associated with an outlet or group of outlets, you can view all outlets assigned to that customer, along with the type of devices assigned and the power rating of each device.
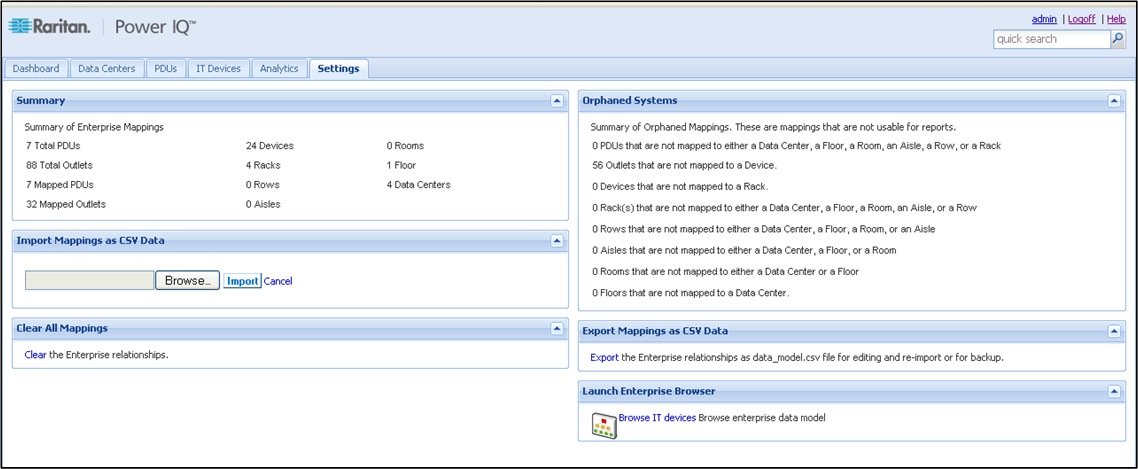
Import & Export Data
Seamlessly import all data for easy set-up and export for your use.
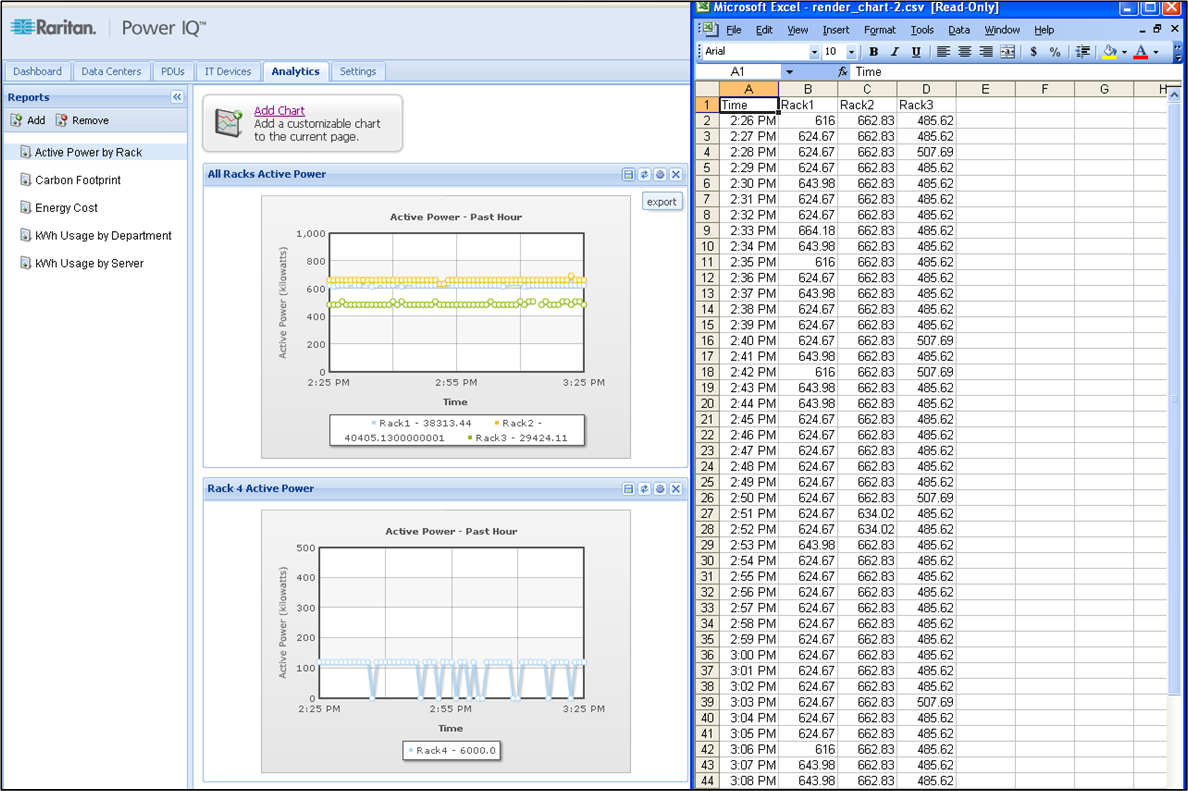
Export Graphed Data to CSV
An example of a CSV file, exported as an Active Power by Rack request.
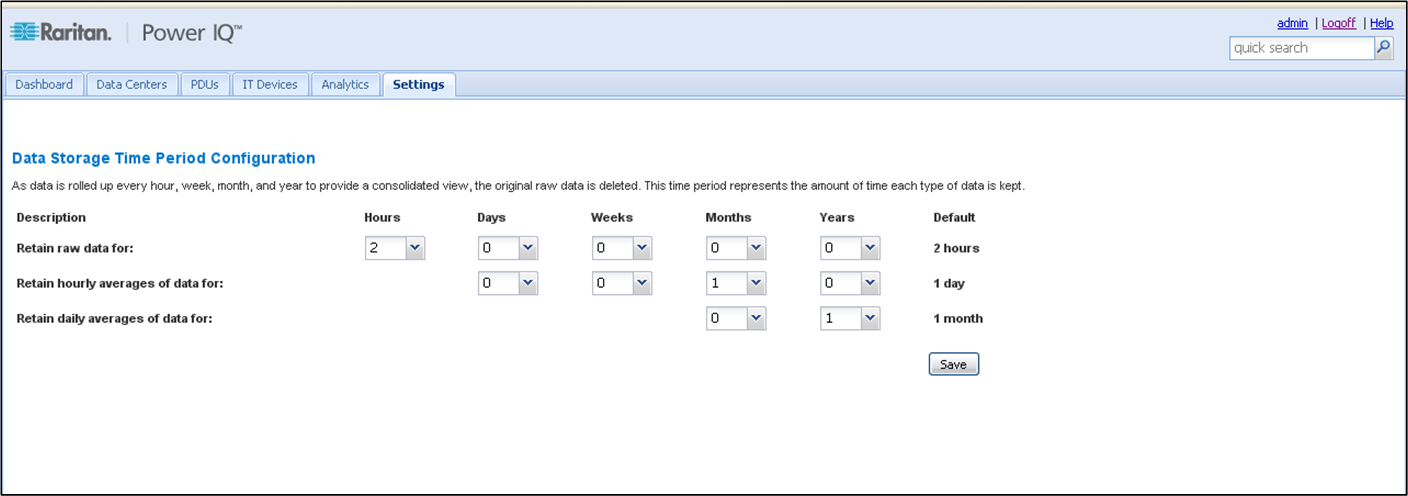
User Configurable Data Retention Period
Configure how long you want to retain data. For example, you can keep monthly max, min and ave. for 5 years.
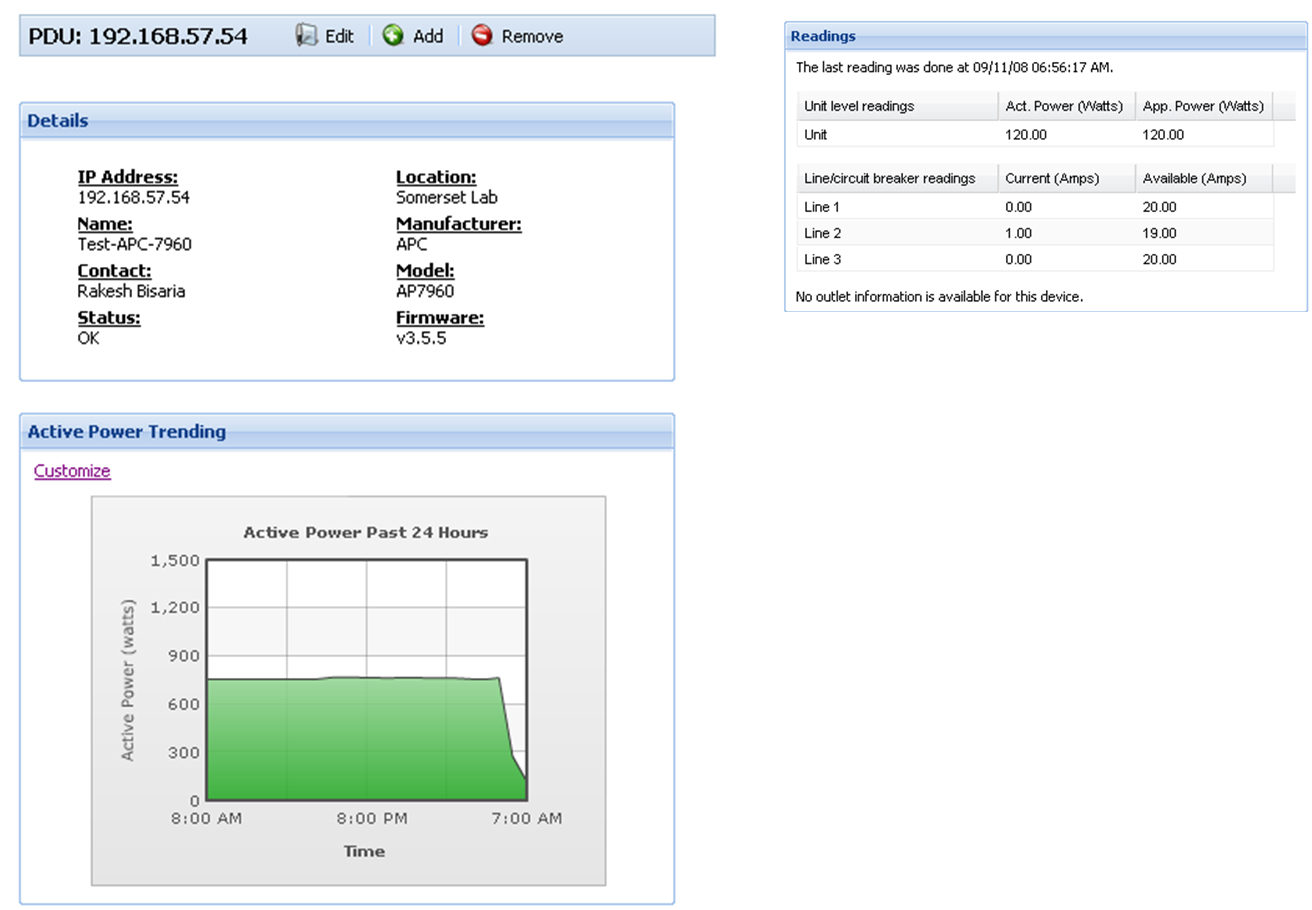
APC 3-Phase PDU
This PDU page enables you to trend unit level active power and view current results. This is an example of an APC 3 phase rack PDU.
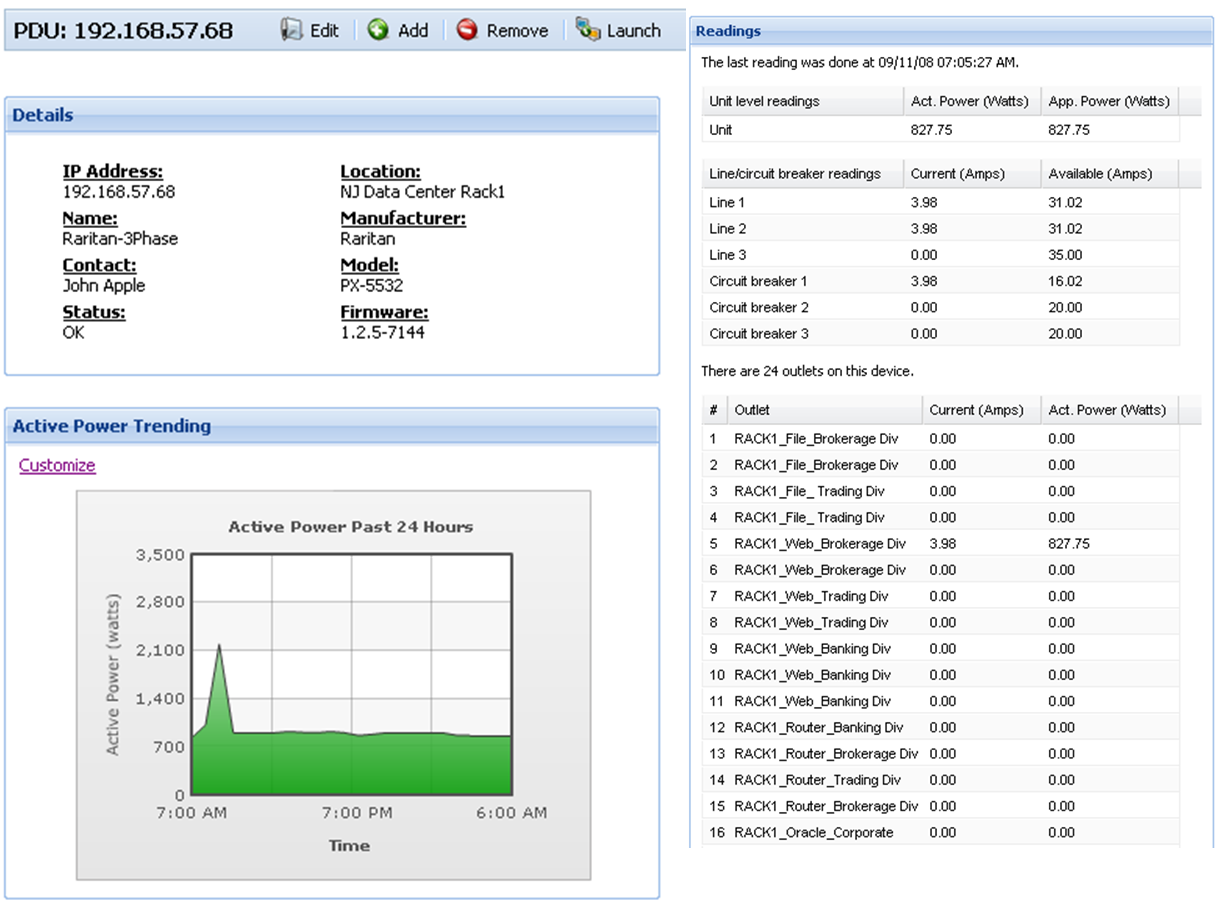
Raritan 3-Phase PDU
The Raritan PDU page lets you trend unit level active power and view current results at the unit, line and outlet level from all Raritan PX PDUs.
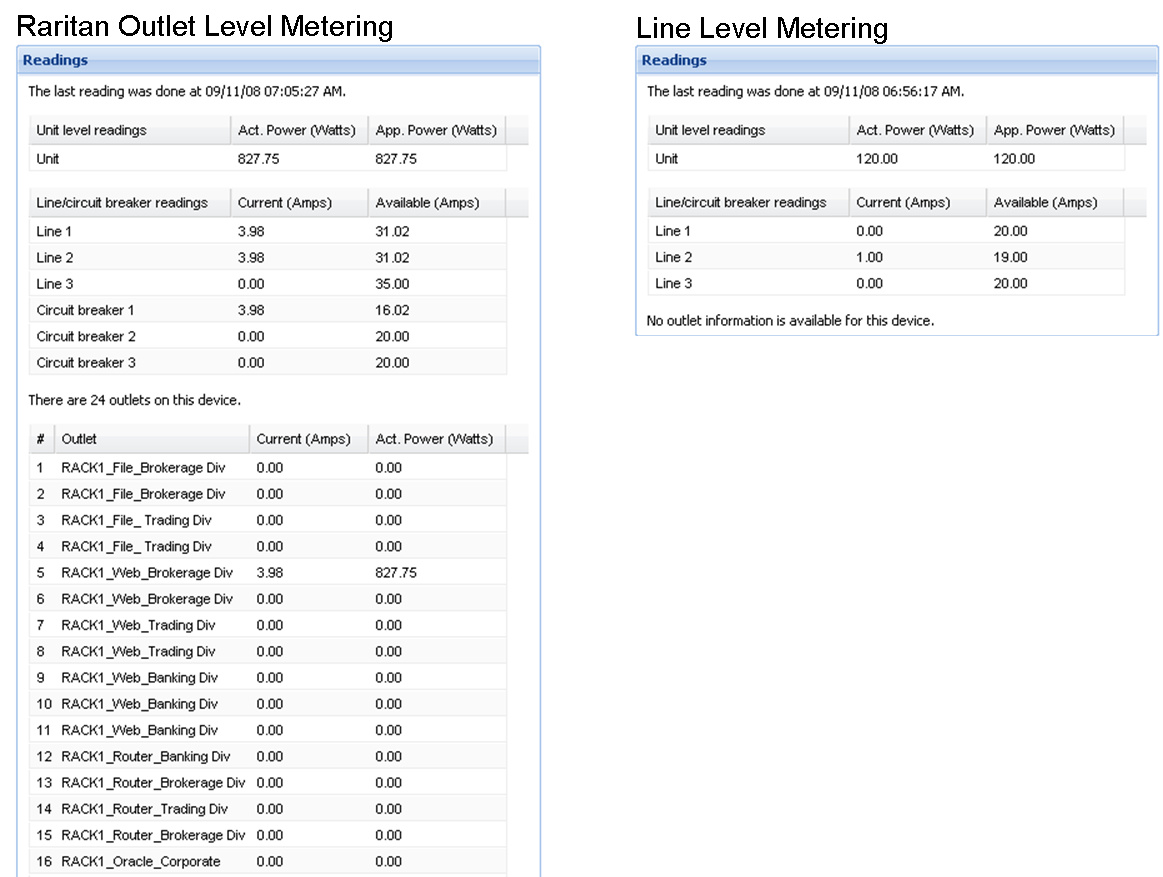
Outlet level vs. Line Metering
Raritan outlet level metering enables more precise business division and IT device reporting, which gives you greater understanding of your device usage and more accurate chargeback opportunities for your customers.
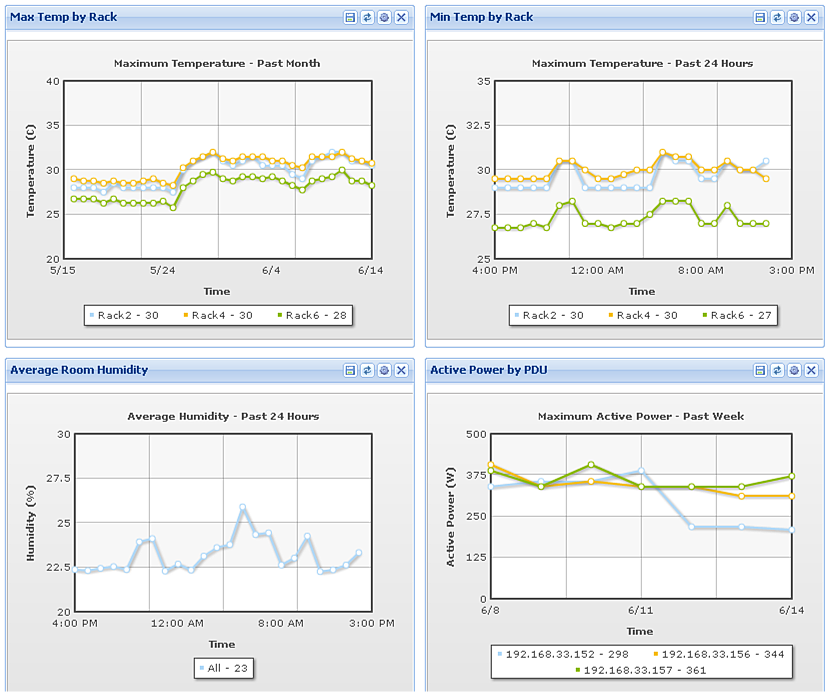
Environmental Analytics
Power IQ lets you monitor and measure rack temperature and humidity. It can also create reports that show maximum, minimum and average readings.
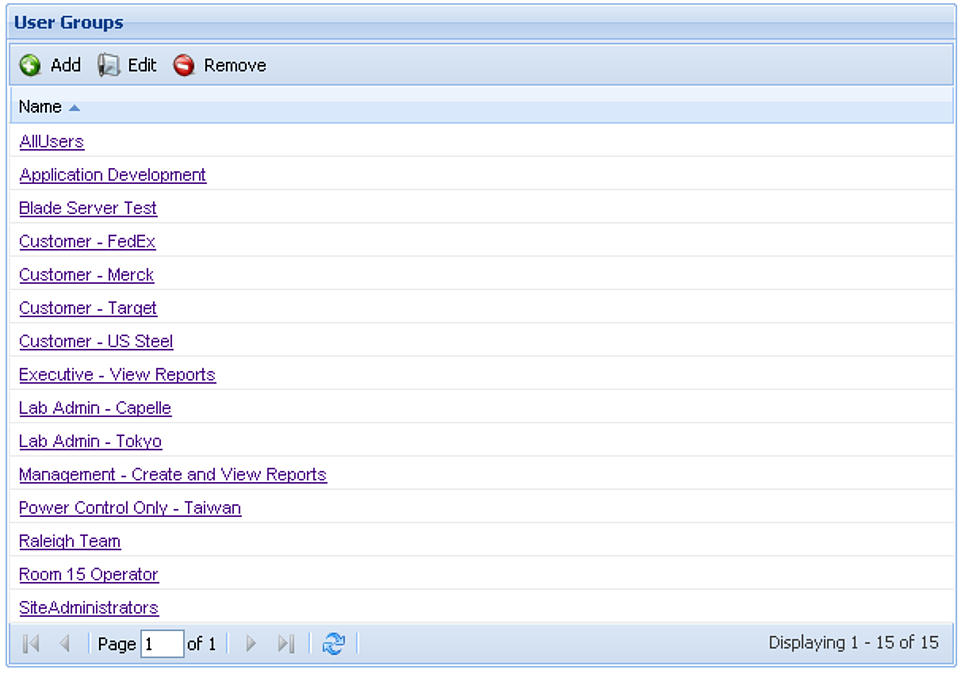
User Groups & Permissions
You have the ability to create a wide variety of user groups and assign permissions based on criteria that work best for you.
You can assign access permissions by:
Device / Rack / Rows / Rooms / Sites
Functional permissions can be set up for:
Settings / User management / Device management / Power Control / Report creation / Report viewing
Scheduled Power Control Operations
Schedule one time or recurring power control operations for energy efficiency or maintenance purposes, this may help you qualify for energy rebates.
Power Control of Device Groups
With Power IQ, you can set up power on/off sequence and delay of IT devices within a rack or device group.
Local Settings
Power IQ also lets you produce energy cost reports in the currency of your choice.
APC 7900
An example of Power IQ working with an APC switched PDU specifically, viewing power control for the unit and unit level metering.
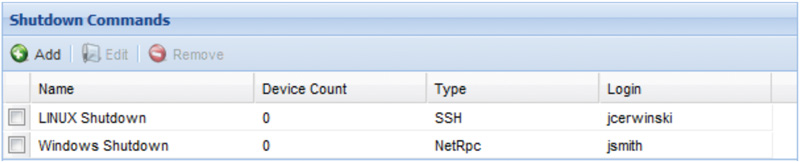
Agentless Graceful Shutdown
Schedule one-time or recurring shutdowns of operating systems and outlets for efficiency or maintenance purposes. Use standard or custom scripts.
Our smart rack view page with quick charts provides one click access to rack power, cooling, airflow and events. This new view makes three-phase load balancing easy.
User-Configurable Dashboard
The user-configurable dashboard provides a large screen, centralized view of power and environmental health, energy capacity and consumption, weather services and maps.
Power Capacity Gauge
Real-time power capacity utilization at any level in your data center or lab (PDU, rack, row, busway, room, etc.). See current, maximum and minimum load over selected time period.
Power Capacity Days of Supply Forecast
Understand your real-time power load, rate of change and forecasted trends at all levels of your infrastructure with our capacity forecast charts.
Central PDU Console
One "pane of glass" to manage all your rack PDUs and in-line meters - APC, Avocent, Cyber Switching, Geist, MRV, Raritan, Server Technology and more
Cooling Chart
Understand if you are compliant with manufacturer´s and industry-accepted recommendations, and project how much you can save by increasing room ambient temperatures.
Vendor Agnostic Monitoring and Management
Through one Web browser, the scalable Power IQ monitors and manages PDUs from APC, Avocent, BayTech, Cyber Switching, Geist, HP, Knurr, Liebert, MRV, Raritan, Rittal, Server Technology, UNITE and more.
Create Custom Reports
A powerful reporting function in Power IQ allows you to generate custom reports at the outlet, IT device, customer, department, rack, zone, floor, lab and data center levels. You can generate reports that reflect active power, energy cost and consumption, carbon footprint, temperature and humidity.
Report by Customer or Department
An example of a report that charts the energy used by a customer or department.
Report Energy Cost
You can also create reports that display energy costs over time for comparison purposes.
Report Usage via IT device or Outlet
A report charting the energy usage at the IT device level. Similar charts can be generated for usage reports at the outlet level.
Report Carbon Footprint
An example of a carbon footprint report, showing how Power IQ enables you to graph multiple devices on a single chart for comparison purposes, as well as summarize the accumulated total per period.
Report Active Power
Power IQ allows you to both create and save a number of standard reports from a single screen. You also have the ability to create and save a any number of charts within each report.
Data Center/Building Level Settings
Set your peak and off peak cost per Kilowatt-Hour, as well as carbon and cooling factors at each location.
Floor/Zone/Row/Rack & IT Device Level Grouping & Associations
Associate outlets to IT devices. Group devices by customer, type or any use defined fields.
Group via IT Device Owner
Once a customer is associated with an outlet or group of outlets, you can view all outlets assigned to that customer, along with the type of devices assigned and the power rating of each device.
Import & Export Data
Seamlessly import all data for easy set-up and export for your use.
Export Graphed Data to CSV
An example of a CSV file, exported as an Active Power by Rack request.
User Configurable Data Retention Period
Configure how long you want to retain data. For example, you can keep monthly max, min and ave. for 5 years.
APC 3-Phase PDU
This PDU page enables you to trend unit level active power and view current results. This is an example of an APC 3 phase rack PDU.
Raritan 3-Phase PDU
The Raritan PDU page lets you trend unit level active power and view current results at the unit, line and outlet level from all Raritan PX PDUs.
Outlet level vs. Line Metering
Raritan outlet level metering enables more precise business division and IT device reporting, which gives you greater understanding of your device usage and more accurate chargeback opportunities for your customers.
Environmental Analytics
Power IQ lets you monitor and measure rack temperature and humidity. It can also create reports that show maximum, minimum and average readings.
User Groups & Permissions
You have the ability to create a wide variety of user groups and assign permissions based on criteria that work best for you.
You can assign access permissions by:
Device / Rack / Rows / Rooms / Sites
Functional permissions can be set up for:
Settings / User management / Device management / Power Control / Report creation / Report viewing
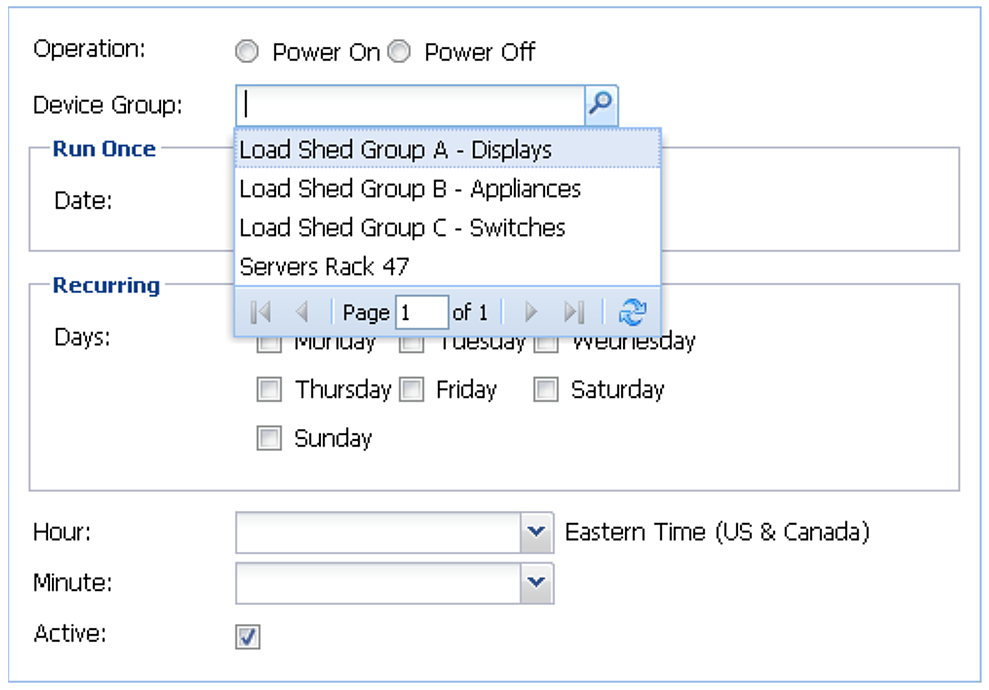
Scheduled Power Control Operations
Schedule one time or recurring power control operations for energy efficiency or maintenance purposes, this may help you qualify for energy rebates.
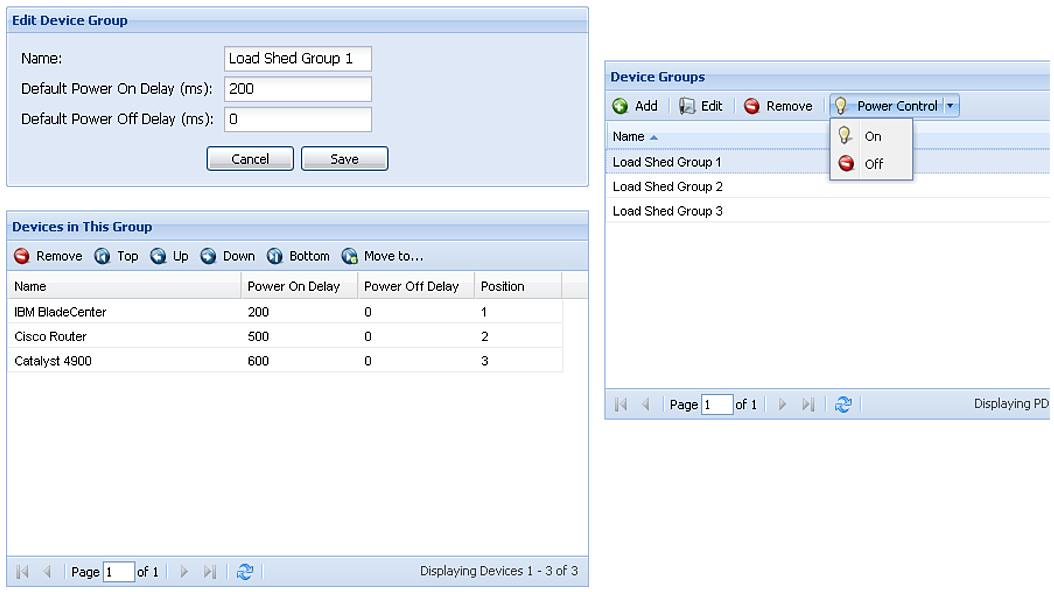
Power Control of Device Groups
With Power IQ, you can set up power on/off sequence and delay of IT devices within a rack or device group.
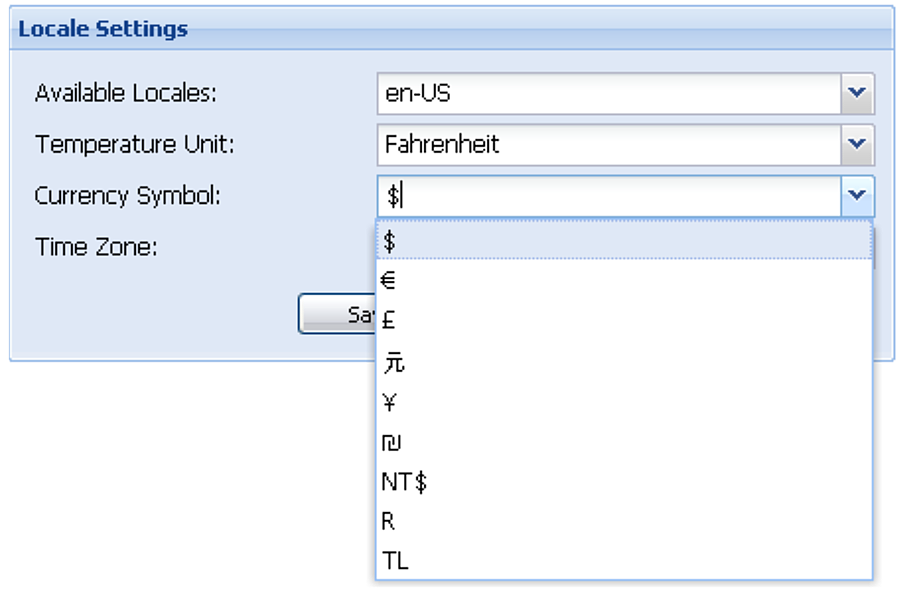
Local Settings
Power IQ also lets you produce energy cost reports in the currency of your choice.
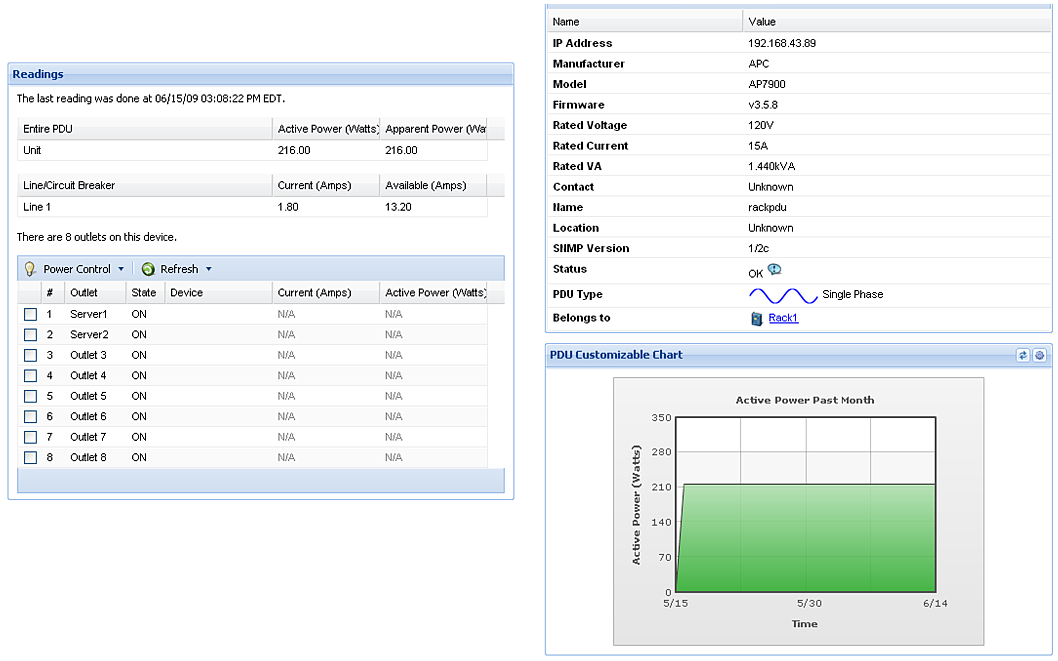
APC 7900
An example of Power IQ working with an APC switched PDU specifically, viewing power control for the unit and unit level metering.
Agentless Graceful Shutdown
Schedule one-time or recurring shutdowns of operating systems and outlets for efficiency or maintenance purposes. Use standard or custom scripts.
 Customers who viewed this item also viewed